
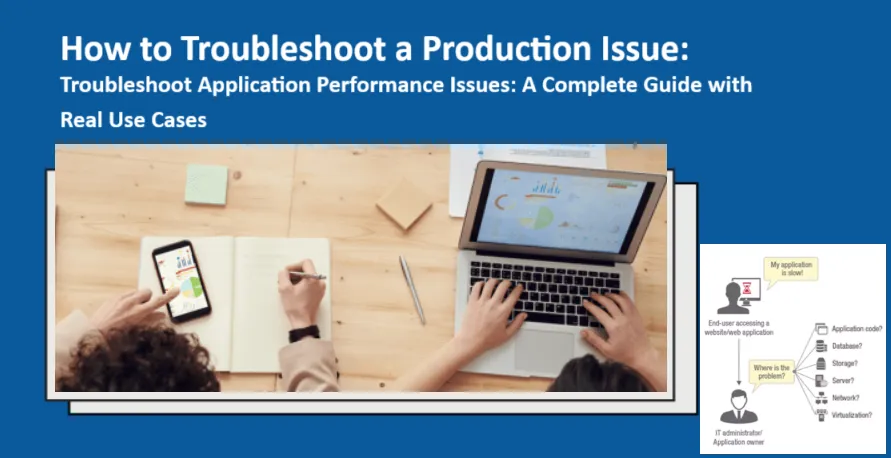
How to Troubleshoot a Production Issue: A Real-World Guide for Developers
When your production application starts acting up, your response can define your credibility as a developer or support engineer. Whether it’s slowness, a crash, or unexpected behavior — knowing how to handle it swiftly and effectively is crucial.
In this guide, we’ll walk through the exact steps you should follow when troubleshooting production issues, based on real-world scenarios and best practices shared in technical interviews. If you're preparing for an interview or just want to sharpen your skills, read this closely.
🛑 Common Production Issues: Where It All Starts
The most frequent problems in production include:
- Application slowness
- Specific functionality failures
- Complete application downtime
1. If the app is completely down
Your first move should be to contact the server team. It could be a server-level issue, and they’ll help you check system health, restart services, or restore from backups if necessary.
2. If the app is slow
Check your load balancer and ensure all instances of the application are up. If one instance is down:
- Work with the server team to bring it back up.
- Monitor user distribution across instances.
3. If specific functionality fails
Usually, this results in a 500-series error — a server-side issue. Common causes include:
- Code bugs
- Missing or inaccessible resources
- Database downtime
🧾 Step-by-Step: How to Handle a Production Issue
🟡 Step 1: Understand the Ticket
Production issues are typically raised via tools like:
- Jira
- Bugzilla
- Zoho
The ticket should mention:
- What’s not working
- Who it’s affecting (10 users? 10,000?)
- Impact level (high/medium/low)
- Severity (S1 to S4 or P0 to P3)
The SLA (Service Level Agreement) will dictate how fast you must respond.
🟡 Step 2: Dive into the Logs
Logs are your lifeline in production troubleshooting.
Access Application Logs:
Most applications log user transactions. These logs reveal:
- What went wrong
- When it went wrong
- Which action caused the error
No UI logs? Then:
- Login to servers (Unix, Linux, etc.) if you have access
- Use commands like grep to search logs for specific errors
- If access is restricted, request logs from the server team
Ensure you check logs from all instances behind your load balancer.
🟡 Step 3: Identify the Root Cause
From the logs, look for:
- Exception messages
- Stack traces
- Error codes
The logs will tell you:
- Which class and line number in the code triggered the error
- Whether it’s a code or data issue
🟡 Step 4: Reproduce and Debug Locally
Once you identify the faulty line:
- Recreate the error in your local or staging environment
- Use debug mode to step through the issue
- Analyze:
- Is the bug caused by bad data (e.g., null values)?
- Or is it a logic bug in the code?
🟡 Step 5: Fix It — Carefully
For Data Issues:
- Ask your DBA for assistance
- Apply controlled data fixes
- Always seek approval before modifying production data
For Code Issues:
- Fix the bug in your dev environment
- Test it thoroughly in QA or staging
- Ensure unit tests and regression tests pass
🔁 Step 6: Move Toward Deployment
Submit a Change Request (CR):
A CR must include:
- The business impact
- RCA (Root Cause Analysis)
- Preventive actions
- Rollback plan
- Estimated downtime
Get Business Approval:
Most production environments (especially monolithic apps) require downtime for deployment.
In contrast, microservices might allow zero-downtime deployment if only a small service is affected.
✅ Final Step: Validate the Fix in Production
After deployment:
- Monitor the fix closely
- Ask business users to validate functionality
- If something else breaks, be ready to roll back
📌 Don’t Forget: RCA and Documentation
Every production issue requires proper documentation:
- Root Cause Analysis
- Fix Summary
- Preventive Action Plan
This is not just a formality — it’s essential for team learning and avoiding recurrence.
🔚 Wrapping Up
Production issues can be scary, high-stress, and high-stakes. But if you stay calm and follow a structured approach like the one outlined here, you’ll resolve issues faster and build trust with your team and stakeholders.
So next time the alarm goes off, don’t panic — log in, dig deep, and troubleshoot like a pro.
**Have you handled a major production issue before? Share your story in the comments below and inspire others to stay calm under pressure.
🔍 How to Troubleshoot Application Performance Issues: A Complete Guide with Real Use Cases
Performance issues can cripple user experience and hurt business. Whether you're preparing for an interview or handling real-time production incidents, knowing how to systematically troubleshoot performance problems is a must-have skill.
In this guide, I’ll walk you through a real-world, scenario-based approach to troubleshooting application performance issues — the kind often asked about in interviews, and more importantly, the kind every engineer faces on the job.
🎯 Step 1: Check for Load Balancer and Instance Health
The first thing to check: Is your application behind a load balancer?
- If Yes:
- Ensure all backend instances behind the load balancer are healthy and running.
- If any instance is down, bring it up immediately with the help of the server or DevOps team.
- If No (Single-instance app):
- Move on to the next step.
🌐 Step 2: Check Network Latency Issues
Sometimes, the root cause is as simple as internet or internal network latency.
- Run network tests to check for latency spikes.
- If your network is slow, it will directly reflect in application slowness.
This is often overlooked, but can save hours of debugging.
🚀 Step 3: Was There a Recent Deployment?
If there was a recent deployment, the new code might be introducing latency.
- Focus on the modules or services touched during the deployment.
- Look at commit history and diff changes if necessary.
- Roll back temporarily if the issue is critical and traced to recent changes.
🧠 Step 4: Monitor JVM/Server CPU & Memory Usage
Check for spikes in CPU or memory usage across your JVMs or servers.
Use tools like:
- top, htop (for Linux)
- Monitoring dashboards like Datadog, New Relic, AppDynamics
- For Java apps: JConsole, VisualVM, or JMC (Java Mission Control)
High CPU/memory usage? Time to dig deeper:
- Which functionality is being used when the spike occurs?
- Are any requests taking longer than usual?
🔍 Step 5: Detect Deadlocks or Memory Leaks
Deadlocks and memory leaks are silent killers.
Use profiling tools:
- JConsole / VisualVM / JMC (for Java)
- Heap dumps, thread dumps during peak hours
- Look for Garbage Collection logs, thread locks, or out-of-memory errors.
Fixing these usually requires code-level analysis and garbage collection tuning.
📊 Step 6: Identify Slow Functionalities
Is only one specific feature or API running slow?
- Narrow it down to the exact functionality experiencing lag.
- Use:
- Transaction logs (if available in the UI)
- Or browser tools (F12 → Network tab) to inspect request timing
👉 Identify requests that take longer than expected (e.g., 60s or more) and investigate what’s happening behind the scenes.
🧾 Step 7: Trace Logs to Find the Root Cause
Your logs are your best friend. Use debug or info-level logs to trace:
- Which method or function is taking excessive time?
- Does the log print timestamps or durations?
- Is there an exception or retry loop happening silently?
If logs are insufficient:
- Add more logging around the suspected slow areas.
- Deploy to a staging environment and reproduce the issue.
🛢️ Step 8: Database Query Bottlenecks
In many cases, it’s not the code — it’s the SQL queries.
- Use EXPLAIN PLAN to analyze query execution.
- Watch out for:
- Full table scans
- Missing indexes
- Inefficient joins
- Optimize the query or add indexes as required.
Pro Tip: Slow query logs in databases like MySQL or Postgres can reveal culprits quickly.
🔧 Step 9: Optimize Application Logic
If the database is not the issue, check for inefficient application-side logic.
- Nested loops?
- Poor caching strategy?
- Redundant service calls?
Optimize the code by profiling performance and applying best practices.
📈 Step 10: Analyze Traffic Load and Usage Patterns
Performance degradation can also happen due to spikes in user traffic.
Ask:
- Did the number of concurrent users increase suddenly?
- Are there automated jobs (cron, batch) consuming resources?
- Is the system auto-scaling properly?
Use traffic monitoring tools like CloudWatch, Grafana, or Kibana to correlate spikes with issues.
⚙️ Step 11: Collaborate With the Right Teams
Depending on the area of concern, involve the appropriate teams:
- Server down or instance crash? → Server/Infra Team
- Internet or internal network issues? → Networking Team
- Application-level bug? → Dev Team
- Database slowness? → DBA Team
Don’t troubleshoot alone — cross-functional collaboration is key in production issues.
Final Words: Be Interview Ready
In interviews, structure your answer like this:
“First, I check for load balancer and server health, then validate any network or deployment issues. I monitor JVM metrics, inspect logs, check for memory leaks, and narrow down to specific functionalities. From there, I trace logs, analyze database queries, and optimize the application logic. Collaboration with relevant teams and using monitoring tools like JConsole, JMC, and browser DevTools helps me pinpoint and resolve performance issues effectively.”
This shows you're structured, experienced, and action-oriented.
✅ Summary Checklist
| Step | Action |
|---|---|
| 1 | Check Load Balancer & Instance Health |
| 2 | Investigate Network Latency |
| 3 | Verify Recent Deployments |
| 4 | Monitor CPU & Memory |
| 5 | Detect Deadlocks & Memory Leaks |
| 6 | Identify Slow Functionalities |
| 7 | Trace Logs & Debug |
| 8 | Optimize SQL Queries |
| 9 | Tune Application Logic |
| 10 | Analyze Traffic Load |
| 11 | Collaborate With Teams |
Performance issues are stressful — but with a calm, systematic approach, they’re solvable. Whether you're cracking interviews or managing live environments, this checklist will keep you ahead of the game.